Anthropogenic global warming 'stopped' in 1997…and in 1996, 1995, 1982, 1981, 1980, 1979, 1978 and 1972
On 29 January 2012, the UK’s ‘Mail on Sunday’ newspaper published an amazingly inaccurate article which began with the extraordinary statement: “The supposed consensus on man-made global warming is facing an inconvenient challenge after the release of new temperature data showing the planet has not warmed for the past 15 years”.
Self-proclaimed climate change ‘sceptics’ have for the past few years been recycling the myth that anthropogenic global warming has ‘stopped’. Indeed, an opinion article by former French politician Claude Allègre and 15 friends, published in the ‘Wall Street Journal’ on 27 January, included among its many erroneous pronouncements “The lack of warming for more than a decade – indeed, the smaller-than-predicted warming over the 22 years since the U.N.’s Intergovernmental Panel on Climate Change (IPCC) began issuing projections – suggests that computer models have greatly exaggerated how much warming additional CO2 can cause.”
But what ‘sceptics’ always fail to point out is that, based on their logic, manmade global warming has actually ‘stopped’ nine times since 1970, in 1972, 1978, 1979, 1980, 1981, 1982, 1995, 1996 and 1997. And they fail to mention that the underlying anthropogenic warming trend is clear and unambiguous when temperature data for the past four decades are taken into account.
Here is a graph of global average annual temperature since 1970, using the HadCRUT3 data published by the Met Office| on its website – the vertical axis shows values of temperature anomaly – the difference between the annual global average temperature and the mean value from the period between 1961 and 1990.

Using simple linear regression (ordinary least squares) we can detect and measure a clear trend over the 42-year period between 1970 and 2011, indicating an average temperature increase of 0.151°C per decade. This trend is statistically significant at the 95 per cent level, the standard test which means the probability that there is no warming trend at all in the data is less than 5 per cent.
It is important to note that simple linear regression using ordinary least squares is not really the most appropriate method for assessing these data as it depends on assumptions which are violated by global temperature measurements. Nevertheless we consider simple linear regression here as it is often used by many ‘sceptics’ to underpin their claims that global warming has ‘stopped’.
So now let us look at just the last 15 years of annual average global temperatures, plotted in the graph below.
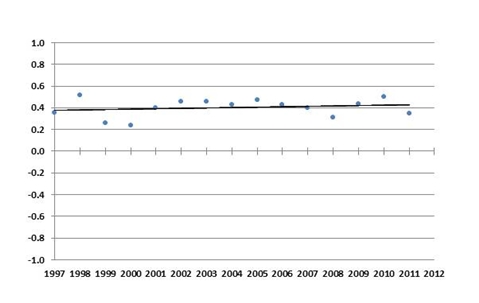
Using simple linear regression, we can see that the measurements for 1997 to 2011 define a warming trend of 0.034°C per decade, but this is not statistically significant at the 95 per cent level. This is the sole basis of the ‘sceptic’ assertion that there has been no anthropogenic global warming since 1997.
But now let us look at every consecutive 15-consecutive-year period of data within the entire dataset for 1970 to 2011. If we apply ordinary linear regression to each period, the results we obtain are listed in this table.
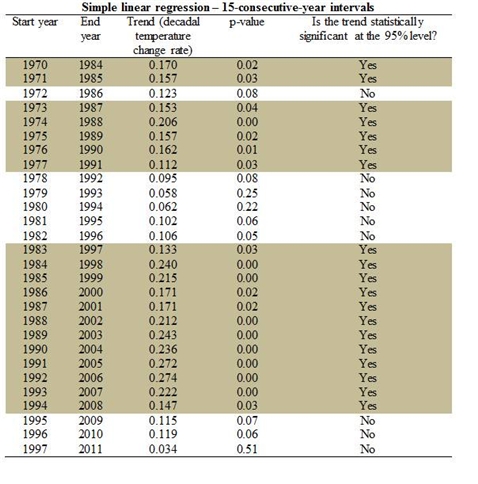
We can see that there are nine periods in which the data does not define a trend that is statistically significant at the 95 per cent level (p-value is higher than 0.05). Using ‘sceptic’ logic, no anthropogenic global warming was taking place during these periods.
Applying the same logic and technique, some ‘sceptics’ only look back over the past 10 years and claim anthropogenic global warming stopped in 2002. If we apply the same test to every 10-consecutive-year period since 1970, we obtain the results listed in the following table.
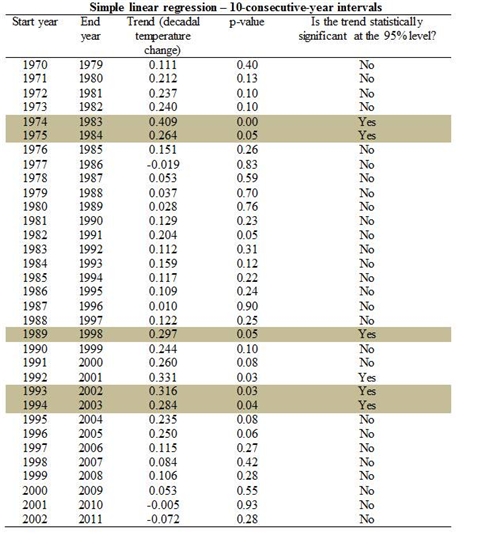
We can see that there were only five 10-year periods since 1970 when there was a statistically significant trend. On this basis, anthropogenic global warming ‘stopped’ in 1970, 1971, 1972, 1973, etc.
What does this show us? When one uses flawed logic, inappropriate statistical methods and very small global temperature datasets, one is unable to detect underlying trends amid the noise. In essence, one cannot see the wood for the trees. To analyse the underlying trend in global temperatures, you need enough data to be able to detect and measure it. Otherwise you can mistakenly conclude that absence of evidence means evidence of absence. It is completely arbitrary to limit an analysis to just 10 or 15 data points. If, for-instance, one considers the last 18 years of data, and not just the last 15, one finds a statistically significant warming trend of 0.118°C per decade since 1994.
Climate scientists are interested in what the noisy global average temperature data of the last 15 years shows us. They do not conclude that increasing concentrations of carbon dioxide and other greenhouse gases in the atmosphere have suddenly stopped causing the Earth to warm, as it is based on sound physics. But they do suspect that other factors may be ‘masking’ the anthropogenic global warming trend, such as a cooling effect caused by an increase in the amount in the atmosphere of aerosols from the burning fossil fuels which reflect sunlight, or changes in solar activity.
So next time you read or hear that anthropogenic global warming ‘stopped’ in 1997, remember just how flaky that claim is.
Bob Ward is policy and communications director and Dr James Rydge is research officer at the Grantham Research Institute on Climate Change and the Environment at the London School of Economics and Political Science (LSE)