


Was the government’s decision to implement lockdowns to combat COVID-19 based on faulty evidence? Philippe van Basshuysen and Lucie White challenge contentions that the decision to institute restrictions was unjustified.
In a recent paper, Winsberg et al. argue that “governments did not meet and have not yet met their justificatory burdens” (p. 216) when imposing lockdowns as a response to the COVID-19 pandemic. They argue that, for a liberal state to infringe upon the basic liberties of its citizens, it must pass a high justificatory burden; for instance, a state would not be justified in imprisoning someone for a crime without collecting sufficient evidence that he is guilty. But, they contend, the quality of the available evidence about COVID-19 – its spread, associated health risks, and the efficacy of possible interventions – was poor, and certainly not good enough to justify lockdowns: “states relied upon bad data and flawed models, and they lacked the other kinds of evidence they would need to justify lockdowns” (ibid.). In this post, we critically analyse some of their claims about the evidence that was available when many governments, including the UK, imposed lockdowns in spring 2020. One would hope that their accusations that states lacked sufficient evidence to justify lockdowns are themselves based on solid evidence. Unfortunately, this is not the case: we contend that their arguments rest on mistaken claims about the available evidence. In the following, we provide a summary of our main points of critique. A more detailed and expansive account can be found in a draft paper.
Bad data and flawed models?
Winsberg et al. focus primarily on the Imperial College London (ICL) model in order to undergird their claim that countries relied on bad data and flawed models. As they note, this “model was used to estimate what public interventions would be needed to prevent hospital systems from becoming overwhelmed” (223) and had a significant impact on UK policy during the first wave of the pandemic. As a result of the recommendations made by the modellers, the UK rapidly switched their strategy from aiming to flatten the curve of COVID-19 infections without suppressing it completely, to trying to suppress the spread of the virus.
Winsberg at al. criticise two aspects of the ICL model – the sparse and unreliable data which formed a basis for projections, and the projections themselves. Let’s first take a look at the data. Here, Winsberg at al. point out that at the beginning of a pandemic, it is difficult to get accurate estimates of the kinds of figures upon which projections much be based, like fatality or hospitalization rates. They point to early figures from the World Health Organization as an example of this: “Early WHO estimates were extremely high, with fatality rates as high as 3.4% and hospitalization rates well into the double-digit percentages” (223). As they explain, these numbers are often overestimated in emergent pandemics due to selection bias – the cases initially identified tend to be the more severe ones, while milder cases go initially undetected.
It’s certainly true that these numbers were overblown – but they don’t mention the actual figures used by the ICL modellers. If we look at these, we see a somewhat different picture. The ICL modellers don’t mention a case fatality rate (deaths per identified cases), which is what the WHO is estimating in the above quote, but they estimate that the infection fatality rate (deaths per overall infections) is 0.9%, taken from a baseline assumption of 0.66% from early figures in China, and adjusted for the older population demographic in the UK. These numbers are broadly consistent with current estimates (see Figure 1). They estimate a hospitalization rate of 4.4%, well below the WHO estimate (although still slightly too high). And R0, the basic reproduction rate of the virus, is estimated to be 2.4 – a low estimate at the time and again, one that remains within the bounds of current consensus.
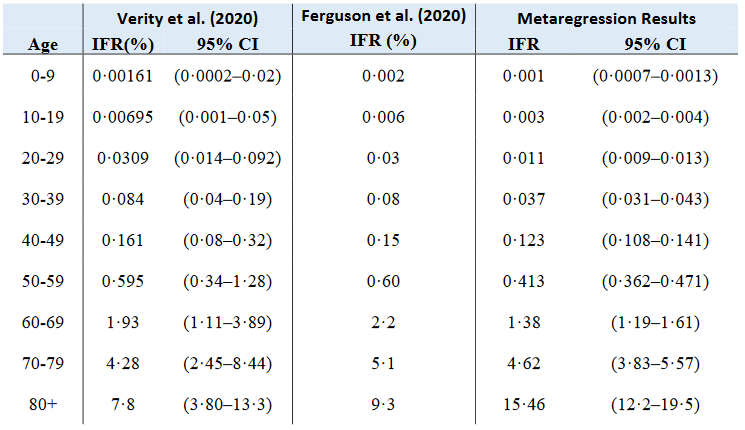
Figure 1: A comparison of the IFR estimates from Verity et al. and Ferguson et al. with the results of a December 2020 systematic review and meta-analysis.
So it seems that these early estimates have stood the test of time quite well. But what about the projections made by the ICL modellers? Winsberg at al. contend that
…the model performed poorly at anticipating ICU demand, which was at the heart of the policy recommendations that emerged from the model. Recall that the ICL scientists recommended a policy of “maximum suppression” (Ferguson et al. 2020). This was the most draconian set of policies the group imagined. They anticipated that even maximum suppression would at first barely avoid overwhelming the UK’s existing ICU and ventilator capacity, and it would then require cycling the economy on and off until a vaccine was available. Despite less than maximum suppression, this did not occur (2020, 225)
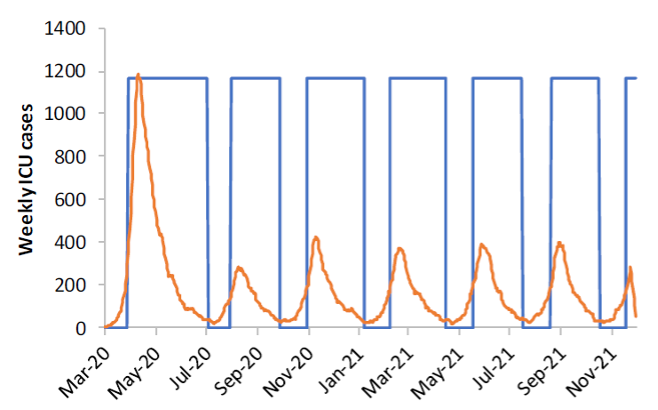
Figure 2: A graph from Ferguson et al. displaying projected ICU demand under their most stringent suppression strategy, under the assumptions R0=2.2, school/university closures and social distancing are triggered when COVID-19 ICU cases hit 100 per week, and cycled off when they hit 50 per week. The blue bars represent the times where all measures are in place. This graph is used by Winsberg et al. to illustrate their claim that the ICL model made overly pessimistic projections concerning peak initial ICU demand. This scenario, more optimistic than the one we consider below, suggests that initial ICU demand will peak at 1600 beds (see Figure 3).
What Winsberg et al. refer to as “maximum suppression” is a combination of four measures;
- “case isolation” (symptomatic cases stay home for 7 days);
- “voluntary home quarantine” (all household members remain at home for 14 days following identification of a symptomatic case in the household);
- “social distancing” (all households reduce contact outside household, school or workplace by 75%) and
- “closure of schools and universities”
Immediately following the publication of the ICL report, on 16 March, the UK did indeed implement case isolation and voluntary home quarantine and recommended social distancing in addition to recommending that those over 70 stay home altogether. Measures including the closure of businesses and the dispersal of gatherings of more than two people were mandated on 23 March to ensure higher compliance. School closures were announced in much of the UK on 20 March. Although universities were not forced to close, many of them had suspended many face-to-face activities by this time too.
The fact that the policies implemented do not (contrary to Winsberg et al.’s contentions) deviate that significantly from the policies modelled (at least during the first wave of the virus in the UK)1 allows us to compare the projections with what actually happened. It’s actually a bit tricky to evaluate the claim that “the model performed poorly at anticipating ICU demand” during the initial peak, because the ICL team present a range of projections for peak ICU bed demand based on a range of different scenarios.
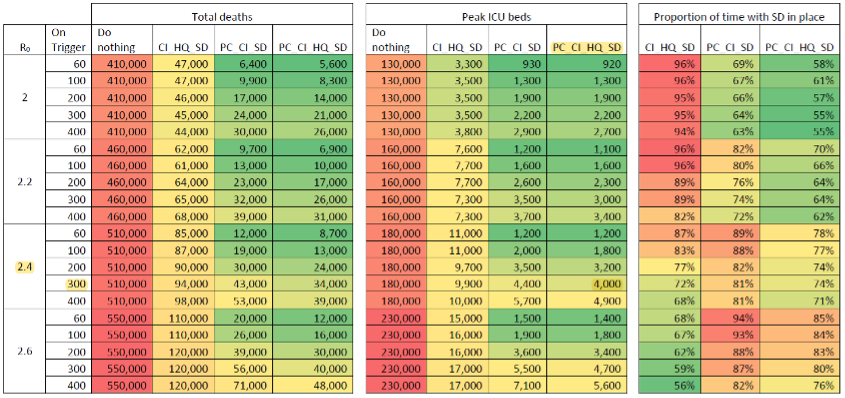
Figure 3: Overly pessimistic results? Estimates of total deaths over 2 years, peak ICU bed demand, and proportion of time with social distancing in place, by values of Ro, and for different combinations of measures (PC=school/university closures, CI=case isolation, HQ=voluntary home quarantine, SD=social distancing). PC and SD are implemented when new diagnosed COVID-19 cases in ICUs exceed “on trigger” values, and cycled off when they drop to 25% of that value. Other measures are assumed to be implemented in March and to stay in place. Ferguson et al. note that “peak GB ICU surge capacity is approximately 5000 beds”.
As we can see here, the ICL team imagine that social distancing and school and university closures are triggered when new COVID-19 cases diagnosed in ICUs reach certain numbers (while the other measures are assumed to kick in in late March). In the lead up to 20 March (by which time, as we’ve seen above, these measures were largely effectively in place), the number of diagnosed COVID-19 cases in UK ICUs grew by about 300. So if we take this as the number at which these measures kick in (which we might expect to generate a slightly elevated estimate, because, as discussed, many of the recommended measures were in place a few days prior to this date/late March), and stick with the ICL team’s baseline assumption that R0=2.4, we see they estimate that the demand for ICU beds will initially peak at 4000. In April, during the initial first-wave peak demand, roughly 3900 ICU beds in were occupied in England alone. So it seems that the model, given these parameters, did not perform poorly at anticipating initial peak ICU demand, and did not generate overly pessimistic projections.
Are lockdowns effective?
Winsberg et al. also call into question the efficacy of lockdowns as a means of containing the pandemic. They argue that “we lack empirical evidence that extensive lockdown policies or maximal suppression work at all” (2020, 228; emphasis in original), claiming that a literature research revealed no peer-reviewed papers showing that lockdowns are effective in combating any pandemic. However, by the time of their writing in May 2020, there was, for example, at least one peer-reviewed paper available, not cited by Winsberg et al., showing that lockdowns and other public health measures decreased the virus transmission rate in China. The only paper that they briefly consider is a working paper by Friedson et al. assessing the effectiveness of the lockdown in California, which they dismiss, however, as having “significant limitations” (228).
To assess this criticism, we should first take a look at Friedson et al.’s methodology. They compare the development of COVID-19 in California, after a state-wide lockdown was imposed on 19 March, with that of “synthetic California”. This is a model that represents the counterfactual situation in California if no lockdown had been imposed on that date. The relevant counterfactual is achieved by taking linear combinations of other states, such that the result resembles California in certain key aspects (such as population density and policies, e.g. travel restrictions). Synthetic California, however, is only made up of states that imposed lockdowns at least five days after California, if at all (see Figure 4 for an example of states used for synthetic California).
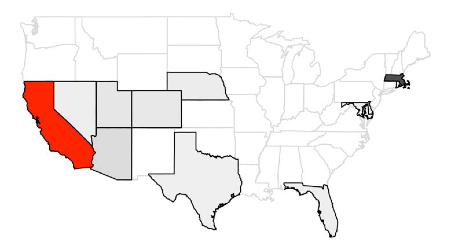
Figure 4 Example of states (in grey) that are used as donor states for synthetic California (darker shades of grey denote greater weights of states); from Friedson et al. (2020). Different sets of donor states and linear combinations thereof are used to achieve robust results.
In order to achieve robust estimates of the net effect of the lockdown, Friedson et al. compare the development of cases in California to the developments in a range of different “synthetic Californias”, i.e. different sets of states and linear combinations thereof. For example, Figure 5 shows how cases develop for an instance of synthetic California and in actual California. It indicates that a few days after the lockdown is imposed, a gap starts developing, showing that the lockdown “flattened of the curve”. Overall, Friedson et al. find that the lockdown reduced the number of cases in California by 125.5 to 219.7 per 100,000 population in the investigated period.
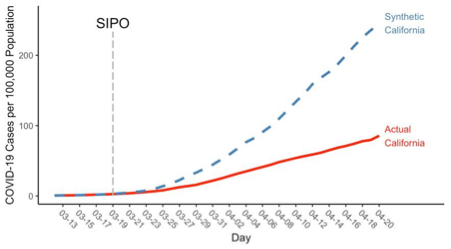
Figure 5 Example of the evolution of COVID-19 cases in actual California and synthetic California, for a given set of assumptions on synthetic California (equal COVID-19 cases on 3 pre-treatment days and urbanicity). The lockdown (“SIPO” – shelter-in-place order) was issued on 19/03. From Friedson et al. (2020).
Why does this study have “significant limitations”, according to Winsberg et al.? They complain that “it counts drops in deaths five days after California’s closing as evidence that lockdowns work. Since the virus takes longer than that to incubate, this drop could not have been caused by the lockdowns” (p. 228). This claim does not concern the above estimates of cases, and thus it falls short of invalidating Friedson et al.’s analysis. But is it nevertheless true that the study commits this fallacy when estimating the number of deaths prevented by the Californian lockdown? Friedson et al. in fact include two models in their analysis, one of which forces the death rates of California and synthetic California to be equal for 13 days after the lockdown is imposed (this amounts to an assumed median incubation period of around 5 days and a median period from symptoms-until-possible-death of 8 days). In this model, shown in Figure 6, it is obviously not true that drops in deaths five days after the lockdown are taken as evidence that lockdowns work: a gap in the death rates develops only later.
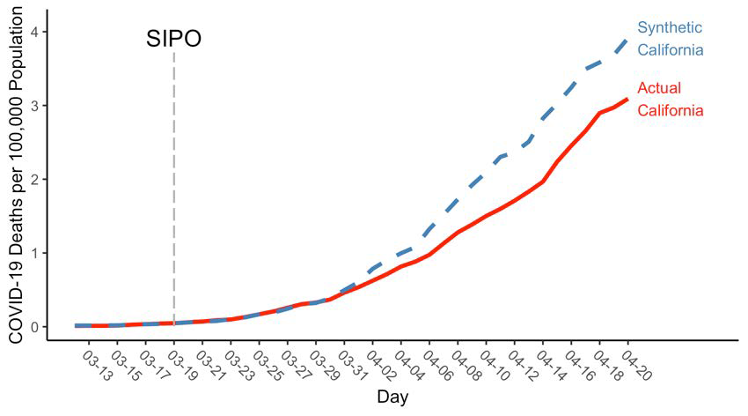
Figure 6 Estimates of deaths per 100,000 population: death rates forced to match for 13 days following the SIPO. From Friedson et al. 2020.
However, Friedson et al. also include a less conservative approach in their paper, in which a gap develops after six (6) days following the lockdown, which seems to be the model to which Winsberg et al. object. Does this invalidate their methodology? Not in itself, because the causal mechanisms that may have caused the death rate to fall may be complex. For instance, people might have engaged in increased social distancing even prior to the state-wide lockdown. Thus, to effectively criticise this model, Winsberg et al. would need to show that lockdowns had no additional effect on the death rate declining – which they don’t. (For a more thorough discussion of the same fallacy, see this paper.)
Conclusion
Winsberg et al. fail to show that the ICL model relied upon bad data, or that it generated poor and overblown predictions. They fail to take into account literature on the effectiveness of lockdowns that was available by the time of their writing, and they do not convincingly criticise the study that they do consider. Because it is not sufficiently supported by evidence, their conclusion that lockdowns weren’t justified does not follow. We haven’t, herein, shown that the lockdowns were in fact justified – this would require a detailed analysis of the epistemic situation in which governments found themselves, as well as country-specific features (implementing lockdown measures in India, for example, will be a very different proposition to implementing them in the UK). What we hope to have shown is that the general claim that lockdowns weren’t justified has not been established because Winsberg et al. fail to convincingly criticise the scientific basis on which these policies were built. Before we can begin to assess whether governments had sufficient evidence to impose restrictions upon their citizens, we must be clear on the evidence upon which they were acting.
By Philippe van Basshuysen and Lucie White
Philippe van Basshuysen is a postdoctoral researcher at the Leibniz University Hannover and research associate at the Centre for the Philosophy of Natural and Social Science (CPNSS) at LSE. His research is in the philosophy of economics and public policy, with a focus on public health.
Lucie White is a postdoctoral researcher at the Leibniz University Hannover. She specialises in bioethics and the ethics of technology.
Notes
1 – After this first wave, UK policy departed from these recommendations, so we can no longer read much into the projections. But we can compare them to what happened during the initial first wave, where policy followed the recommendations to a degree.
