One of the core challenges for news organisations is how to improve their engagement with audiences – past, present, and potential – so they can better target them with content, offers, advertising, and subscriptions.
As part of the JournalismAI Collab, our team set out to define the opportunities of content recommendation, loyalty, and audience engagement. By defining the transactional opportunities in this field, we then examine how to create overarching strategies incorporating both human and AI elements.
A survey of publishers both in and outside of this group showed that each one measures loyalty, in the context of retention and churn, in very different ways. This document provides some of the best practices around measurement, tactics, and actionable intelligence to improve reader retention and mitigate churn. It recommends where and how AI can become an essential tool for any publisher seeking to understand and improve audience engagement and loyalty.
This report is divided into four interrelated sections.
1) The first section explains ways to identify and quantify Churn, how to apply specific indicators to retain more users, and a range of AI solutions to these challenges.
2) The second section is a Loyalty Playbook, which details best practices and real-world applications where AI has helped develop deeper relationships with audiences and led to real successes.
3) The third section looks at the exciting opportunities of AI-driven Gamification to provide deeper engagement and user rewards, as well as a driver of content discovery.
4) The fourth section tackles the issue of Content Recommendation, including models, case studies, and suggestions for implementing AI-driven best practices in your newsroom.
EDITOR'S NOTE:
This report is produced by an international team of journalists as part of the JournalismAI Collab, a project of the Polis think-tank at LSE, supported by the Google News Initiative.
The Collab is a collaborative experiment where news organisations from around the world teamed up to explore innovative solutions to improve journalism through AI.
You can find out more about the initiative, and about the work of the other teams, on the Collab page.
1. Identifying and Quantifying Churn
Churn is defined differently by different organisations. A subscription news business might define churn like this:
"A user who cancels their subscription and/or does not renew within a pre-specified window (e.g. 30 days) after their subscription expires or lapses."
A news organisation whose business model is not based on subscriptions might instead define churn as:
"A user who previously engaged with a product, who no longer engages with the product within a pre-specified window (e.g. 14 days)."
Understanding churn can give us valuable insights into our customers. By deepening our knowledge of churn, we can develop the most effective targeted value propositions, and use data about churn to improve coordination across all departments, leading to greater efficiency.
Typically, a media company will want to reduce churn and grow retention. But what exactly that means can be defined in several ways and differs by company and business application. Here are some questions that might help organisations to better define these metrics:
- What’s the desired behaviour you expect from your customers? For example: How many articles read per month? How much time spent on-site? Or it might be about specific actions taken like subscribed to a newsletter or upgraded to a paid or premium account.
- What is the customer behaviour you instead want to avoid?
- What are the top 5% of your users – the most engaged or highest revenue-generating – doing that you would like to replicate across the range of other users?
- What’s the average frequency with which your readers return to your content? Segment or cluster users by behavioural patterns to identify any trends that might help your strategy.
The technique of Churn Risk Scoring has become a crucial issue for businesses and publishers dealing with retention and loyalty. Generally, readers and customers don’t tell us when and why they are at risk of dropping out or switching to a competitor – but they do send signals. We can identify, interpret, and react quickly to forestall that through the use of AI.
“Churn Score” is a statistical machine learning prediction value that estimates the state of churn for a given user at any given time. It does this by using metrics such as demographic information, browsing behaviour, and historical purchase data, and so builds predictions for how long a user will be a customer. As churn definitions differ across businesses, rather than build a single model, we aim to highlight the leading indicators that we consider relevant across many organisations and publishers.
Determining the key risk factors for churn led us, through research across our own companies and more widely, to identify six classic indicators:
- Drop in website activity: Time spent and pages viewed
- Drop in login activity
- Social activity, including negative comments and dislikes
- Customer service issues, such as complaints or unsubscriptions
- Newsletters activity: Lower opening rate or unsubscribes
- Smaller basket size: Downgrade Subscriptions or unfinished onboarding
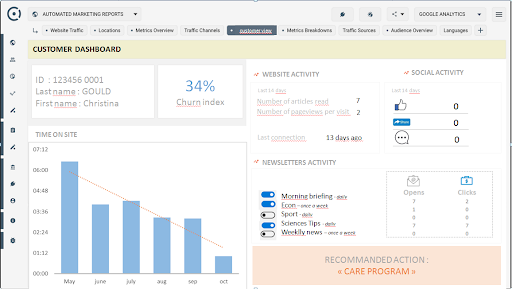
How a publisher’s dashboards might reflect the leading indicators of churn:
XYZ Publishing is a daily news provider running a freemium website and a print version. XYZ Publishing also publishes a monthly magazine. From the dashboard illustration below, we can see the overall site performance, including time spent on the site and the bounce rate (the number of users who view a single page and then leave). We can also see an individual user's habits, churn rating, newsletter open rates, and social media engagement interactions with the brand, among other metrics.
It also highlights the 'Recommended Action' process to ensure the user feels connected to the brand and re-engages with the content offered by the publication.

Targeting at-risk readers
Asking customers why they have decided to stop using a service or product has little effect because by then it’s already too late. Their decision is made, they have moved on. A better strategy would be to run surveys on “at-risk” readers to retain them before it's too late. For example, you could trigger a pop-up survey based on customers segmentation and churn risk leading indicators.
Ask for users information early on
To meet subscribers’ expectations, Mediacités (a French online investigative outlet) submits a quick satisfaction survey to each new subscriber, asking them simple questions. The response rate is a massive 98% and the result is that they establish an immediate relationship with the new user, and gather insights into what that person wants.
Use A/B Testing
A/B Testing allows you to compare one or more versions of a webpage or app against a control page, aiding understanding of which elements perform better for an audience.
- Iteration is key to align efforts with customers’ evolving expectations.
- Use A/B testing as a tool to understand visitors and know what elements positively or negatively influence their subscription decisions.
- Use the results to draw clear conclusions by validating one or more hypotheses with data-driven analysis.
One good example of A/B testing in publishing is the New York Times’ AB testing solution, ABRA (A/B Reporting and Allocation architecture). ABRA aims to empower every team at the New York Times to engage in a wide range of experiments for desktop and mobile platforms. The introduction of ABRA has fostered a culture of experimentation in the newsroom, which contributed to a redesign of desktop and mobile home screens, to experiments in paywall innovation and personalisation, as well as headlines optimisation.
During the first COVID-19 breakout, the Italian national daily La Repubblica saw a huge increase in subscribers. The number more than doubled (from 70,000 to 160,000) in two months. After six months, the title now has an average churn rate of 50%: 50,000 of the new 90,000 subscribers are still paying for premium services. This is due to a strategy based on content, marketing, and technology;
- A/B Testing to improve the subscription funnel (different colours and text for calls to action, new entry points);
- More premium content production (articles, newsletters, podcasts);
- Daily reports shared with the newsroom and weekly meetings with editors to share data and KPI’s on subscriptions and retention;
- Pricing strategy with special offers to users who decide to unsubscribe;
- A new Customer Relationship Management (CRM) system is under construction.
Where does AI fit in customer management and churn indicators? It streamlines processes, gives us greater, faster insights powered by data into user behaviour and need states, and allows publishers to respond with minimum effort. Examples of this include:
- Create and push content to users who show a lack of loyalty (i.e. newsletters);
- Manage dynamic paywalls and different pricing offers to increase subscriptions and retention;
- Create tailored datasets, reports, and KPI’s for editors and desks within the newsroom;
- Build a better performing Customer Relationship Management (CRM) system.
2. The Loyalty Playbook
This playbook looks at how news organisations can Understand their potential customers; Identify satisfaction elements for customers; Determine the identifiers of disengagement and customer loss
These concepts must not exist in silos in a publishing business. It’s as important for the most junior reporter to understand why these aspects are part of the organisation’s strategic goals as for the CEOs. There is a risk that information exists in pockets of good practice. With loyalty, customer attraction/retention, and churn, these will generally sit within marketing functions. Pockets of good practice are generally small, like-minded, and performance-focused. People working on them tend to focus on a specific task rather than building quality relationships beyond it.
However, the information held in these pockets or silos can be more widely distributed through the introduction of human and AI/ML practices that give more access to knowledge across the wider business – especially in Editorial and Product, where teams may be the first point of contact for UX or customer engagement.
Critical capabilities within the front-facing staff should include: Understanding the business model of the organisation; Knowing how each part of the business adds value; Understanding how and where the company is competing.
This guide will not provide a straight ‘one-size-fits-all’ approach to loyalty and engagement. Every organisation is different with varying goals, missions, and strategies, so there is no single solution to solve all your retention challenges.
This guide will:
- Define churn in the context of media organisations;
- Give the user a set of tools with which to create their Churn Score tool;
- Set out guidelines for employing the Churn Score tool;
- Provide examples of where AI can offer better and deeper insights, and trigger conversion or prevent disengagement of users;
- Outline key actions people can take, in association with the AI elements, to promote success.
These are Recency, Frequency, Volume (commonly known as RFV) and together represent a technique that database analysts use to segment customer data. This works by plotting the activities of a user against three key actions and is a measure of how recently a customer last purchased. These behaviours are:
- Recency: when’s the last date/time that the user came to your site?
- Frequency: how many visits or sessions within the past 30 days?
- Volume: how many page views and how much time spent on-site?
Scoring RFV on a per user basis enables you to roll up user data by article, topic, section, geography, platform, or any other grouping you’d like and leverage this metric quite broadly.
An abstracted index or aggregated metric containing several variables is complicated, so it helps to turn this into a percentage and reframe RFV as a quality user score. Our quality user % simply indicates the % of users who obtain a certain RFV threshold or higher.
The algorithm created recalculates the score for each of our users automatically every day and stores a historical record of each user's score. In this way, we can track increases and decreases across users, topics, desks, and more. It is important to compare to the baseline. Using this metric to compare across desks and topics is interesting, but not as actionable.
It will tell you about one type of content (e.g. fashion topics may not draw in as many high-quality users as election coverage), but it is much more useful to understand an increase or decrease in quality score across the same topic or desk over time. For example, if election coverage was drawing very high-quality users a few weeks ago, and it’s no longer doing so, understanding what happened and how you can regain those users or engage them more meaningfully is critical.
Another way publishers should consider segmenting audiences is by satisfaction, or the value the customer is getting from a news product. How do you measure user satisfaction? On a social media site, this may constitute the amount of engagement and interactions on that platform.
Core KPIs may be page views, customer registrations, and daily app users. But there is another important metric that newsrooms should consider: Active Engaged Time.
Active Engaged Time (AET) is the amount of time a user is actively doing something on the page (as opposed to time spent on page – which can easily be down to an open, ignored browser tab). AET measures the time when a reader is active on a page, from scrolling to playing a video or using a widget. It matters because it shows what content users are invested in, is holding interest, indicates a need state being met, and suggests themes or topics that may lead to deeper engagement.
Other engagement metrics to consider related to retention:
- Comments
- Sharing
- Logged-in / Registered
- Subscribes to newsletter(s)
And revenue-generating ones:
- Attends event or webinar
- Purchases product
- Subscribes to publication
While the syntax and the number of segments for these types of users may vary across organizations, the frameworks are generally similar. An organization can segment and sub-segment its users by engagement levels into one of these buckets. Here’s a simplified sample breakdown of loyalty segments:
- Flyby → 1 session/visits within 30 days
- Regular → 2-5 sessions/visits within 30 days
- Loyal → 5+ sessions/visits within 30 days
You can enhance these definitions with duration, page-views, and further slice and dice segments by platform (mobile, desktop, app), geography, source, channel, section, topic, and much more.
This empowers your team with the following:
- A deeper understanding of how these users are behaving;
- An understanding of movement across these segments (if there’s a large shift from Flyby to Regular or vice versa, it’s important to understand what drove it and why);
- Dimensional slices of user behaviour – are there more loyal readers in my home market versus international? Are app users more loyal than desktop users?
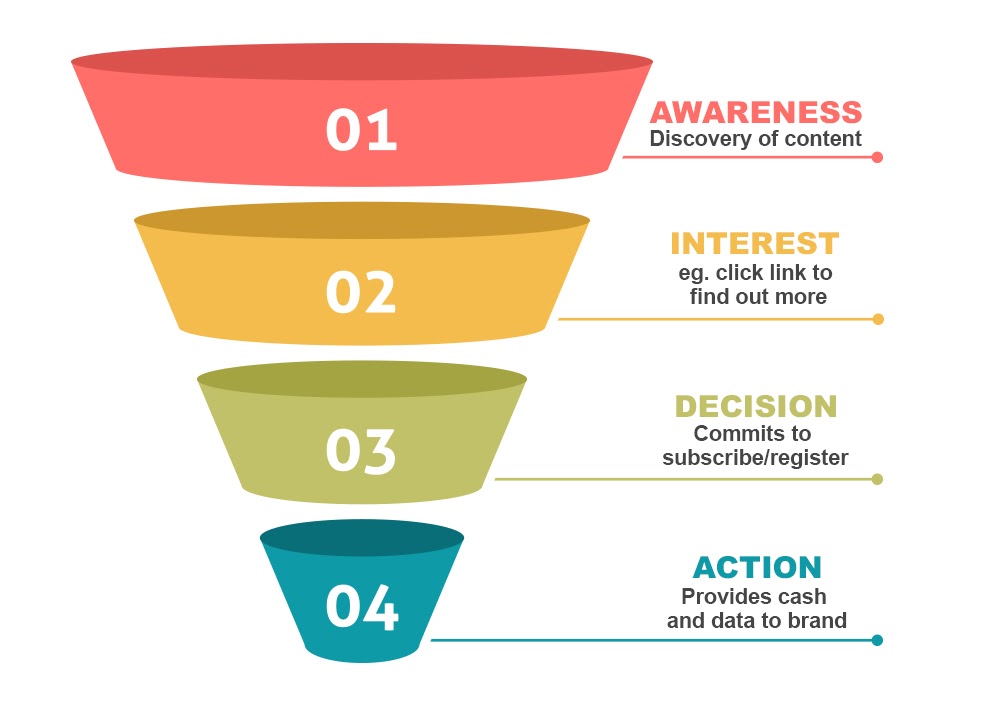
Conversion Funnel
The conversion funnel is a tool used by marketers to chart the progress of a customer base, from attracting to growing to retaining. It uses various technologies to indicate and track opportunities. The funnel in this illustration has been adapted to show the progress of a potential customer from flyby to engaged fan of a publisher’s content.
Let’s look at how these concepts work in practice with a case study from the South China Morning Post.
Bluefin - Loyalty Propensity Model
At SCMP, we developed an internal tool which we codenamed Bluefin. Bluefin tuna is a fish that returns to its birthplace to hatch. By applying our Bluefin scoring system, we would be able to spot which of our users are the most likely to come back to our platforms. The purpose of the engine is to use the historical behaviour of readers to predict the following:
1) If a reader will come back in the next 30 days (recency).
2) If a reader will have more than X sessions, in the given month (frequency).
These two concepts of recency and frequency will be combined and each user will be scored using an algorithm. The higher the score, the more likely the reader is valuable, and therefore, we can potentially spend to invest in their continued engagement.
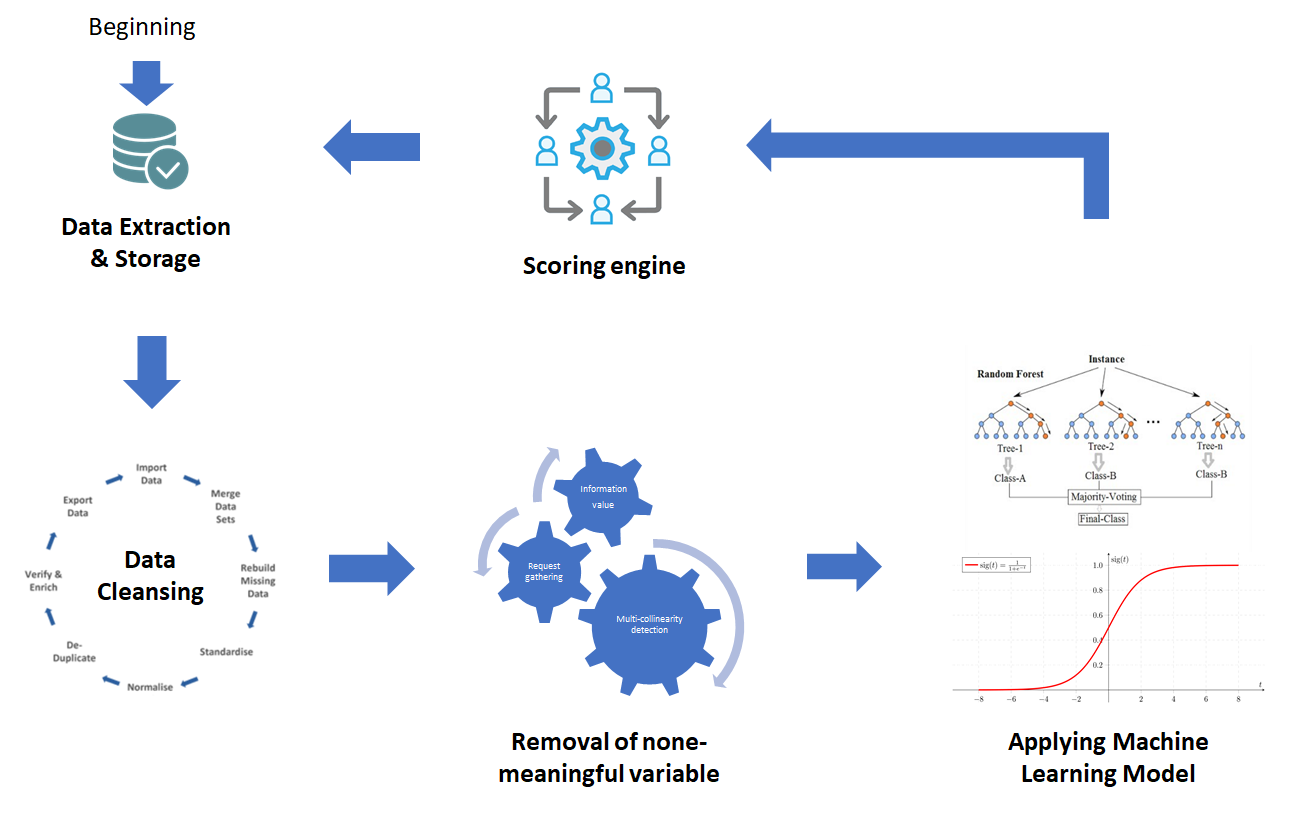
Here’s how it works:
1) We collect anonymised behavioural information on our users – country, time spent on the website, pages visited, topics read, etc. over time.
2) Based on this historical data, the engine will identify patterns that drive increased recency and frequency.
3) Once a reader is browsing the website, Bluefin will compare their behaviour to these patterns and assign a score to the user to estimate their likelihood of return.
4) On a monthly basis, the model will refresh, teaching itself and learning from the latest data to recalibrate the scoring engine incorporating any new variables that might come into play.
Bluefin is now capable of adapting this scoring system by platform, source, channel, and several other dimensions.
For a more detailed look into how this works, we’ve put together a workflow diagram below:
Results:
We ran a test against a sub-segment of users testing the Bluefin model against our standard retargeting campaigns and found that page views per unique visitor (PV/UV) increased by 55% and cost per page view fell by 37%. The results were consistent even after several subsequent tests and campaigns. Bluefin enabled us to stretch our marketing dollars to only focus spend on users with a higher propensity to re-engage with us and eventually become loyal readers.
Personas are representations of who our readers are. It is an archetypal description and a humanistic story around an individual customer. It is not simply illustrating what a reader does or how they consume products, but also why. Good personas provide context on who our readers are and enable teams to take actions to improve engagement.
The South China Morning Post uses machine learning to assist with the enhancement of user-profiles. SCMP has implemented a customer data platform, surveys, quizzes, and polls to deepen our understanding reader preferences and behaviour, and invested heavily in incentivising users to log in so that we’re not wholly reliant on the ever-fleeting cookie. The investments have enabled us to create personas which will help us better serve our readers.
We wanted to cluster users based on behaviours, regardless of referring source, platform, or geography. To do this, we used k-means clustering to group our users into cohorts and ran around 40 iterations to observe the optimal turning point in the WCSS (Within Cluster Sum of Squares). (More on this here if you wish to explore further.)
This clustering yielded six personas with varying degrees of engagement levels, subscription potential, and interests. The sizing of these clusters also varied substantially.
We then spent several weeks running test campaigns, with A/B testing to validate if one cohort outperformed another one in propensity to subscribe to newsletters or registered, to validate engagement levels and subscription propensity.
We interviewed dozens of users across each persona to validate the quantitative data with qualitative data. Some of the questions we asked included the following:
- What are our users’ goals and motivations for visiting SCMP?
- How did they find us? Through which touch-points, channels, or funnels did they come through?
- How often do they visit SCMP?
- What is their preference in terms of the format of content (bite-size, long-form, video, podcast, etc)?
- Who are they (age, gender, industry)?
- What types of content (topic, section, content) do they consume?
- Where did they come from (geographically)?
- When do they usually visit SCMP (e.g. time of day, day of week etc)?
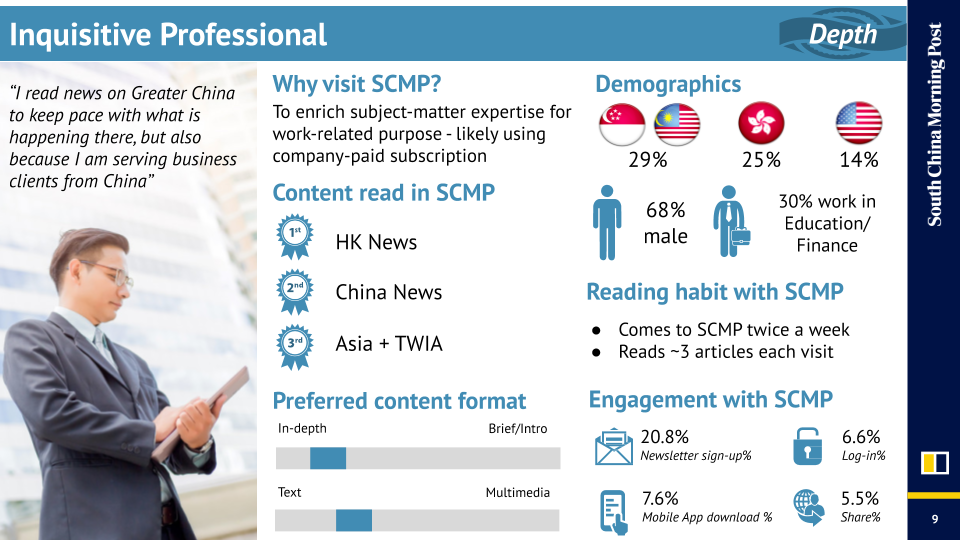 Example: the Inquisitive Professional
As we built these personas over several months, we knew that the most important output of this project was to communicate and share these personas across the company and empower various key stakeholders to make these personas actionable and integrate the usage of them into our daily workflows.
1) Marketing: launch acquisition, retargeting, and retention campaigns to increase user engagement with custom messaging for specific personas.
2) Product: customize user funnels and experiences per persona so our users can have a more relevant experience, customize content recommendations for individual personas.
3) Advertising: enhance personas further with first-party data and provide partners and advertisers with deeper insights on who their potential customers could be, and enable more targeted ads, higher conversion rates, and a more relevant ad experience for our readers.
4) Editorial: Develop content around specific persona types and collaborate with the Product team to customize the experiences.
A Reach plc study attempted to answer the question of why and how people consume news, combining interviews with behaviour tracking. This was run over two weeks to build up a more complete understanding of the company's users.
Four clusters of motivations for why people consume news were identified, and it was also determined that these motivations can be held simultaneously. These are:
- Time Filler: Using news and other mobile entertainment to fill gaps in the day with subjects of interest and be entertained.
- Citizen: Using news to anticipate and understand national, international and local issues that will impact them and the people they are responsible for – to inform decision making.
- Social: Using news to understand what people they see in social contexts are talking about, and be able to participate.
- Professional: Using news to be aware of and anticipate events that will impact their career and industry.
Each of these motivations showed different behaviour for how and where they consumed news.
Editorial content can also be segmented similarly:
- Live and instant (breaking news; instant information)
- Inspirational and helpful (things to do, entertainment)
- Time-filling and entertaining (lean-back reads)
- Empowering or involving (surveys, calls to action, comments)
How loyalty is defined and measured varies across publishers and companies – e.g. by identifying users who have visited your site at least eight of the last 16 days.
Loyalty metrics are a vital part of the conversion funnel as they can indicate at what point users convert to subscribers or at least register on your platform.
Shifting a user from a ‘flyby’ to a ‘loyal and invested’ member of your audience can be incentivised through both tangible and intangible rewards. For some brands with paywalls or subscription-based models, this may mean tangible rewards such as prizes. For free models, it might mean incentives that give the user more status such as gamification incentives or closer interaction with journalists. Sometimes a simple acknowledgement or response to a comment on a story can start to trigger loyalty.
3. The Gamification of News
To create an effective churn score, we need to have access to a whole spectrum of data about our users including metrics like what stories the user has read and how many comments they have made. All that data benefits publishers but how can it also be useful to the user? We know that people are interested in self-generated data. They use smart devices to measure how many steps they have taken, they use apps like Duolingo to learn languages – there is no end to the number of self-improvement apps out there. It seems we can’t get enough data about ourselves. One thing a lot of these websites and apps have in common is that they are based on gamification.
It’s a modern term but the idea of gamification is nothing new. The classic example is Scouts’ badges: the Scout gets the reward of a badge for achieving a task – but it goes deeper than that. We could say that gamification in general encompasses goals, rewards, progression, achievement, risk, and competition.
A user sets a goal. Each step towards that goal is measurable, so progress can be tracked. Once the goal is met, you are rewarded and, of course, a new goal is set. Risk is introduced by making some achievements ‘losable’ if you do not keep up with certain tasks. Competition happens because users can see other users’ progress. This type of gamification is now mainstream. In the idea of some people, gaming might still be a niche hobby. But, with smartphones, all of that has changed. The world population in 2020 is 7.8 billion. Mobile gaming industry size reports show that a whopping 2.4 billion are mobile-game players. That is over 30% of the world’s population!
Sites like language app Duolingo and fitness app Strava use gamification very effectively. The Duolingo mascot, a cute owl who is not averse to laying on a guilt trip, reminds you if you’ve missed a day of study. The Strava app constantly keeps you updated when one of your peers has run 5k and beaten their personal best… and is that better than your personal best?
There are some key elements that systems using gamification usually share:
- Points system
- Achievement badges
- Leaderboards
- Suggestions or plans on how to improve
Lots of gamification systems also use design elements like micro-animations and computer-game inspired graphics.
There are potential pitfalls for news. One big difference between news and other areas where gamification is used is that news covers a whole host of subjects. So if you’re learning a language or want to start running, you can design the gamification aspects to integrate quite easily. However, when we talk about gamification in news, do we really want cartoon characters popping up or cute animations playing out while someone is readying a serious news story? Of course not.
Applying the principles of gamification to news is not as simple as adding a points system and making a few achievement badges. We have to be conscious of avoiding the use of what some might see as childish graphics and inappropriate design. However, that does not mean we have to throw all of the playful aspects of gamification out, we just have to be careful with the integration.
Perhaps most of the graphical side of gamification could sit on a users profile page which solves the problem of inappropriate design elements interfering with the most serious of stories. Also, the design of the gamification elements would be different for each title. After all, you would never design a tabloid and a broadsheet title the same, so the gamification fonts, colour and icons would be different for different titles.
But gamification doesn’t even have to be that complicated. In fact, there is one aspect of design that is a classic element of games that you can find across all sorts of websites.
The Progress Bar
The progress bar is probably the simplest and most effective way to introduce gamification. You probably wouldn’t think of a site like LinkedIn as gamified. But maybe you’ve completed your profile because the "70% completed" profile progress bar was so close to finished. If that's the case, you have been motivated by one of the core principles of gamification.
So what would happen if there was a progress bar showing how many of the available stories on a certain subject you had read? Even better if you could see how many stories the average user had read.
Here is an example showing some of the elements that a user profile page using gamification could include – using a generic design that’s not too over the top but is also not boring. As discussed, the idea would be that graphics, fonts and colours would be tweaked by individual titles:
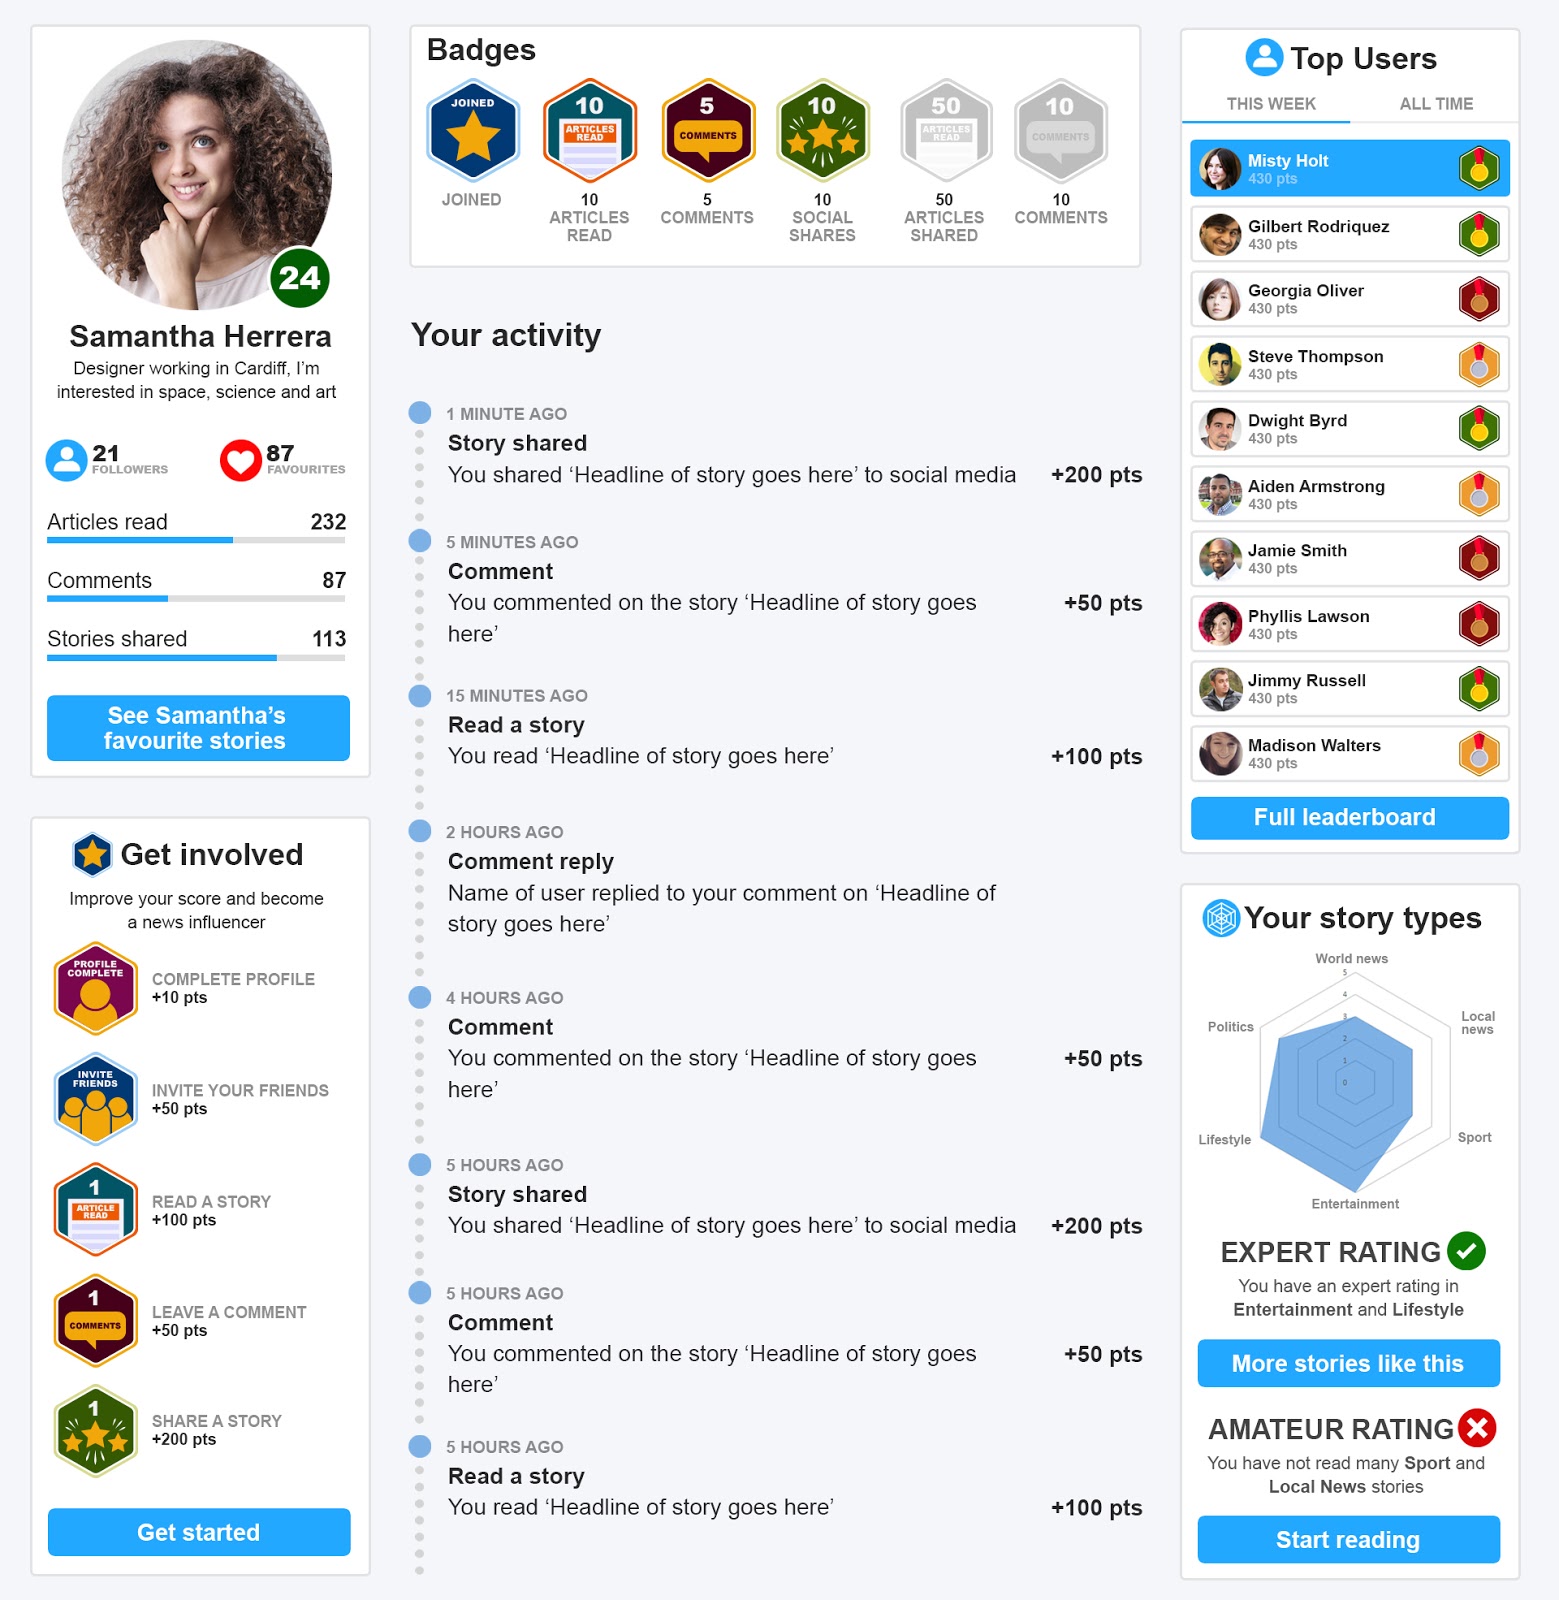 Graphic to illustrate what a news gamification personal profile could look like.
We have all the elements of gamification, including the points system, badges and leaderboards, rewards for reading, commenting, and sharing. There’s even the risk factor with a login streak which resets if you haven’t visited for a set period of time, which is inspired by the streaks in Snapchat.
The main idea behind this version of a gamification system is that it is modular so organisations can pick and choose which elements they have active. But the most interesting element here for news consumption is 'Your Story Types'. This shows the reader exactly what type of stories they have been readi – and what stories they have been missing out on.So if we take, for example, someone who has read a lot of entertainment and lifestyle stories, we can reveal the story types they are not reading and suggest some of the best stories we have covering those subjects. We can introduce the risk element of gamification here too because if someone is listed as an expert in a certain subject area, they can lose that rating by not keeping up to date. And at this point we could utilise the trusty progress bar.
We’ve already said that we don’t want inappropriate game graphics popping up over serious stories. However, a little toaster message telling people that they have read 90% of the stories on a certain subject, along with a link to the stories they’ve missed, could prompt them to read the remaining stories.
There is no one-size-fits-all solution. Different titles will want different aesthetics and functionalities, but gamification doesn’t have to mean only introducing points, rewards and badges. It can be something as simple as a progress bar.
The main idea from a publishers’ point of view is to get people to read more stories but that does not mean engaging in dark design patterns that trick people into constantly clicking or doom scrolling. Gamification has to create value for readers beyond the enjoyability of the gamification system itself. With news, we want to help people find the stories they are interested in and open up a whole world of stories they have not been exposed to.
It’s also worth bearing in mind gamification for all aspects of news sites, not just consumption of stories. For instance, if you want to get to know your readers better and are asking them to fill in profiles, take a leaf out of LinkedIn’s book and add a progress bar to the profile page.
The data we are using to power gamification will be the same as the churn score: exactly what stories people are reading, how long they are reading for, how did they arrive at the story, where did they go next in the story, along with other metrics such as if the user makes comments or shares a story socially.
But the gamification platform itself would provide lots of data to an AI system that could concentrate on user habits and behaviours. After all, an AI system is only as good as the data it is trained with. What are our most engaged users doing? Are people visiting certain pages and immediately leaving? Do most people only ever get to a certain point of a story? These and a myriad of other different points of information would inform us on how to design better user experiences on our website but, more importantly, could generate truly personalised news.
When we say personalised news, we’re not talking about just serving up the same sort of stories someone always reads. Personalisation does not have to be about re-enforcing the echo chamber but breaking that chamber too by nudging people to become more informed about all sorts of stories and subjects that they may not ordinarily read.
Below is a short explainer video, showing some basic concepts of gamification and how it could look on a news site's user profile page:
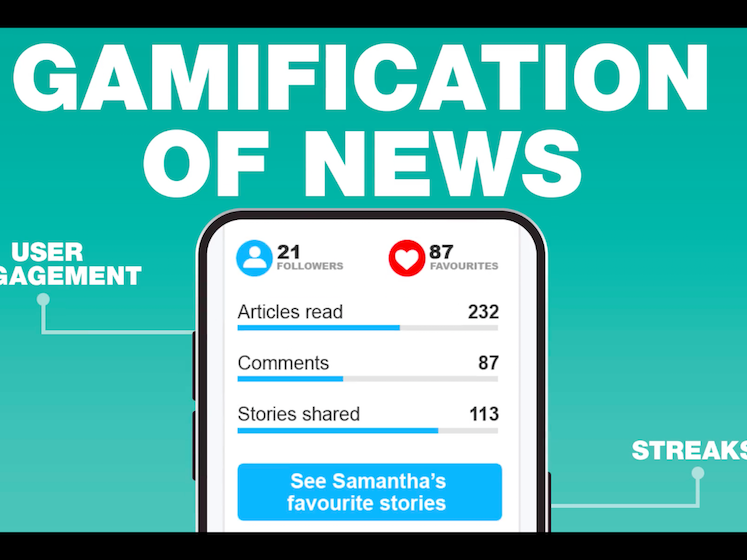 The gamification of news
The gamification of news
The gamification of news
4. Content Recommendation
Among the four news organisations that we interviewed as part of the JournalismAI Collab, all of them produce more than 500 pieces of content every week. With user attention span constantly decreasing, the traditional methods to navigate through this volume of content (categorisation of articles by sections or topics made available via navigation menu) is a real obstacle for recirculation, especially for lightly engaged readers.
Editorial curation and most-read articles are common content recommendations widgets in the news industry. Yet very valuable, the former is resource-intensive, and both are lacking personalisation from a user standpoint.
Other digital industries are facing similar challenges – Amazon with its 12 million products on the platform, Facebook with 350 million pictures uploaded daily, Spotify with 50 million songs in the catalogue – and they have leveraged artificial intelligence to provide personalised recommendations to their users. What can journalism learn from these examples?
Recommender systems can be classified into multiple categories. We listed below what we believe to be the 3 most relevant for news organizations.
1. Content-based filtering
This family of models leverages NLP (Natural Language Processing) to parse and analyse a specific content (title, metadata, summary and/or first paragraphs) and compare it to the corpus of stories available for recommendation. The assumption behind such a model is that if a visitor likes the content he is reading, he is likely to be interested in similar articles.
2. Collaborative filtering
Collaborative filtering is usually based on collecting and analysing information on users’ behaviours, their activities or preferences, and predicting what they will like based on the similarity with other users. A key advantage of the collaborative filtering approach is that it does not rely on machine-analysable content and thus it is capable of accurately recommending complex items such as movies without requiring an “understanding” of the item itself.
3. Hybrid solutions
Hybrid solutions combine two or more models to increase performance. They can be implemented in different ways, among which:
- By combining the recommendations of the different models. For example: showing 3 results from content-based filtering and 3 results from collaborative filtering.
- In cascade: the results of content-based filtering can be used as an input for the collaborative filtering model.
- With weighted scores: a weight is assigned to each model, and each recommendation is scored and weighted based on its model. All outputs are ranked and the top X are shown to the reader.
The key success factor for projects on content recommendation is a cross-departmental collaboration between product, editorial, infrastructure, and data teams, as expertise in each of those areas is necessary.
From an editorial perspective:
- Shall all content be recommended or only the most recent ones (published within X days)?
- Should it include evergreen content? If yes, how to identify it?
- How to exclude some stories on an ad-hoc basis?
- Would branded content be included?
- What would be the balance between editorial curation and AI personalisation?
From a product perspective:
- Should the model be optimised for recirculation, subscription, or engagement?
- What is the desired degree of personalisation and/or serendipity?
- Stories that a user already consumed may not be recommended.
- Articles that have already been recommended to a user in another widget above (from editorial curation for instance) should not be recommended again.
From a technical standpoint:
- Latency requirements between a recommendation request and the engine response.
- Level of service required (uptime) and fallback logic when the engine is down.
- Capacity to handle traffic spike (scalability).
From a data standpoint:
- How to track and monitor the performance?
- How to experiment and enhance the model continuously?
Other elements to take into account:
- Collaborative filtering performs best when sufficient browsing data is collected for each user. For news sites having mainly fly-by users, a content-based filtering might be more appropriate.
- Being able to link the same user across multiple devices (via login for example) would increase prediction accuracy.
- News organisations without technical expertise or looking for fast implementation can leverage off-the-shelf solutions with several vendor options on the market. However, pricing is often linked to the number of recommendation requests – which might not be scalable. The lack of control and ability to customise the model might also yield a lower performance compared to an in-house solution.
- For in-house development, three key factors will need to be balanced for an optimal outcome: model accuracy, infrastructure cost, and latency requirements. The most accurate models require high computational power (i.e. infrastructure cost) and computational time (higher latency). Technical infrastructure can be used to pre-compute.
Performance of systems implemented will vary with news cycle, content produced, and change of user base. Models relying on learning datasets will require regular recalibration to adjust to those fluctuations. New techniques or open-source frameworks are released regularly, often yielding better results. Hence for in-house implementations, we recommend a continuous improvement approach with performance monitoring and constant experimentation/enhancement.
To monitor the performance of recommenders engines optimised for recirculation, the most commonly used metric is CTR (Click-Through Rate), calculated as the ratio between the number of clicks on recommendations over the total number of recommendation impressions.
More advanced models can incorporate time spent on page after a user clicked on a recommendation to estimate its accuracy, or even long term impact on user retention via cohort analysis.
Many factors can influence the performance of a system, such as the location and design of the widget or the loading time of the recommendation. To benchmark a system's performance, one option is to run an A/B test splitting the audience into two evenly distributed buckets with:
- Variant A, the control group, displaying a random selection of stories
- Variant B, the suggestions provided by the recommendation engine
The CTR of variant B must consistently be greater than variant A to demonstrate incremental value for the readers.
An intuitive way to distribute the personalised recommendations is to add a dedicated widget on a news site. However, it should not be restricted to this option. News organisations might consider:
- Tailor-made newsletters
- Personalised push notifications
- A standalone app or website containing only the key content the users is most likely to be interested in
- Chatbot or messaging apps (Facebook Messenger, Telegram, ...)
Content-based filtering could also be used as an internal tool to help newsrooms with manual curation.
CONCLUSIONS: RECOMMENDATIONS FOR NEWS ORGANISATIONS
There is no silver bullet or magical algorithm that will solve churn or increase retention without hard work, testing, and iteration. Each publishers’ customer base is unique and every organisation has different goals.
Understanding and anticipating audience needs is one of the clear areas where AI can support a news media business and, in particular, the newsroom attempting to win new audiences and retain existing users or convert them to more engaged users, or even paying subscribers.
Likewise, understanding the metrics around churn and retention is only the first step. The next and the most critical, is taking action on the data once it’s available. Once these actions have been tested and validated as effective, they should be automated as quickly as possible. Taking the startup philosophy of “launch and iterate” is key. Testing and optimisation should never have a finite end. Just as our world and customers’ lives are ever-changing, so should our products adapt to our customers’ needs.
AI does not exist in isolation – it is a tool to be used by people, not an opportunity to replace people. In journalism, use cases where AI can complement existing methods include assisting news publishers in assessing the distribution and impact of their content; attracting new users; alerting consumers to new content or offers in a timely, efficient way; and helping power a distribution strategy that meets user needs at the optimum time: push notifications around traffic and travel news for the busy commuter are the most simple benefits.
From our research and experiences of speaking with data teams and newsrooms around the world, we recommend the following optimisation and tactics to news organisations:
- Default to auto-renew subscriptions options wherever possible;
- Incentivise longer-term subscription periods with discounts or bundles;
- If a user is not set to auto-renew, send an email reminder to renew subscription 1-2 weeks before it expires;
- Determine a ‘grace period’ for lapsed renewals – this typically varies between publishers from 0 to 30 days;
- Design a ‘win-back funnel’: email, retargeted advertising externally, internal house ads etc.;
- Understand funnel leakage and continually experiment to plug holes;
- A/B test rigorously;
- For app or progressive web app users, push notifications can be more effective than email;
- Even without a paywall or subscription model, you can still have a 'conversion' event: newsletter signup, registration, login, commenting, or other forms of engagement can be considered as conversion;
- For users who show interest in conversion but do not convert, build in automated communications to plug gaps in the funnel akin to 'abandoned cart' messaging for e-commerce.
Alison Gow
Audience and Content Director, North West, Reach Plc (UK)
Connect with Alison on Twitter
Atinouké Roufai
Head of Customer Loyalty and Acquisitions, Nice-Matin (France)
Connect with Ati on LinkedIn
Adam Walker
Multimedia and Interactives Designer, Reach Plc (UK)
Connect with Adam on Twiter