The state of the housing market has dominated headlines as of late, from the government’s stamp duty holiday, to many people choosing to prioritise space after working from home throughout the pandemic, to record interest rates, but how do fluctuating levels of supply and demand affect the housing market?
Professor Gabriel Ahlfeldt, Professor of Urban Economics and Land Development, and Dr Lois Liao, LSE Fellow in Real Estate Economics and Finance, review the origins of remarkable spatial variation in housing market trends in England and Wales.
Do property prices vary significantly between and within cities?
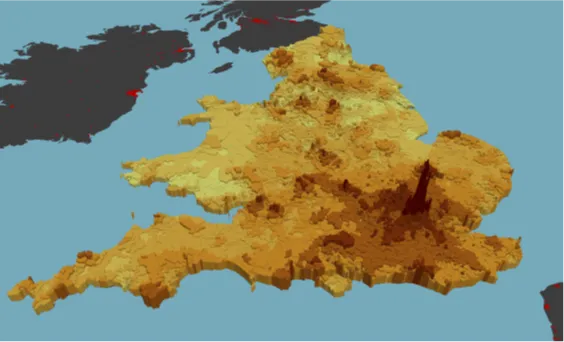
The answer is yes. Figure 1 illustrates the differing sale prices of properties of similar characteristics in various areas of England and Wales (as shown through modified hedonic modelling). Many larger cities stand out in this map, so it seems fair to conclude that prices are generally higher in urban centres. In central areas of London, the price level can even reach 10 times the national average.
Figure 1. Map illustrates price of a representative house in 2020 in England and Wales. The bar height is proportionate to the house price. For further detail on the underlying data and methodology see, this note and this Centre for Economic Performance Discussion Paper
Why do housing prices vary so remarkably between regions?
There are a number of factors that affect housing prices, which we can broadly categorise into demand-side and supply-side factors. Examples of factors of demand include mortgage rates, population, real income level and demand for space. For example, during COVID-19, prices in London rose for houses but fell for apartments, reflecting an increased demand for home-work and garden space. Different attitudes towards homeownership and debt also contribute to variances in demand. In the UK, society holds a strong preference towards homeownership. Given a free choice, 86% of the population prefer to be owner-occupiers as opposed to renting. In contrast, Germany has one of the lowest homeownership rates amongst OECD countries. Besides social norms, public policy interventions also influence overall demand. For example, the UK Government’s Help to Buy Scheme aimed to incentivise first-time home purchase by providing an interest-free equity loan for the first five years to support deposit requirements. Meanwhile, housing policies in Germany incentivise renting by protecting tenant interests.
The supply-side also influences housing prices, including land availability, profitability and regulations. Inflation in construction materials and labour shortage can increase the costs of building. Therefore, profit margin for developers is squeezed unless they are able to pass the costs to buyers, resulting in less incentive to supply. ‘Not in my backyard (NIMBY)’ type of homeowners may also block or increase obstacles for new developments.
What is the real estate cycle?
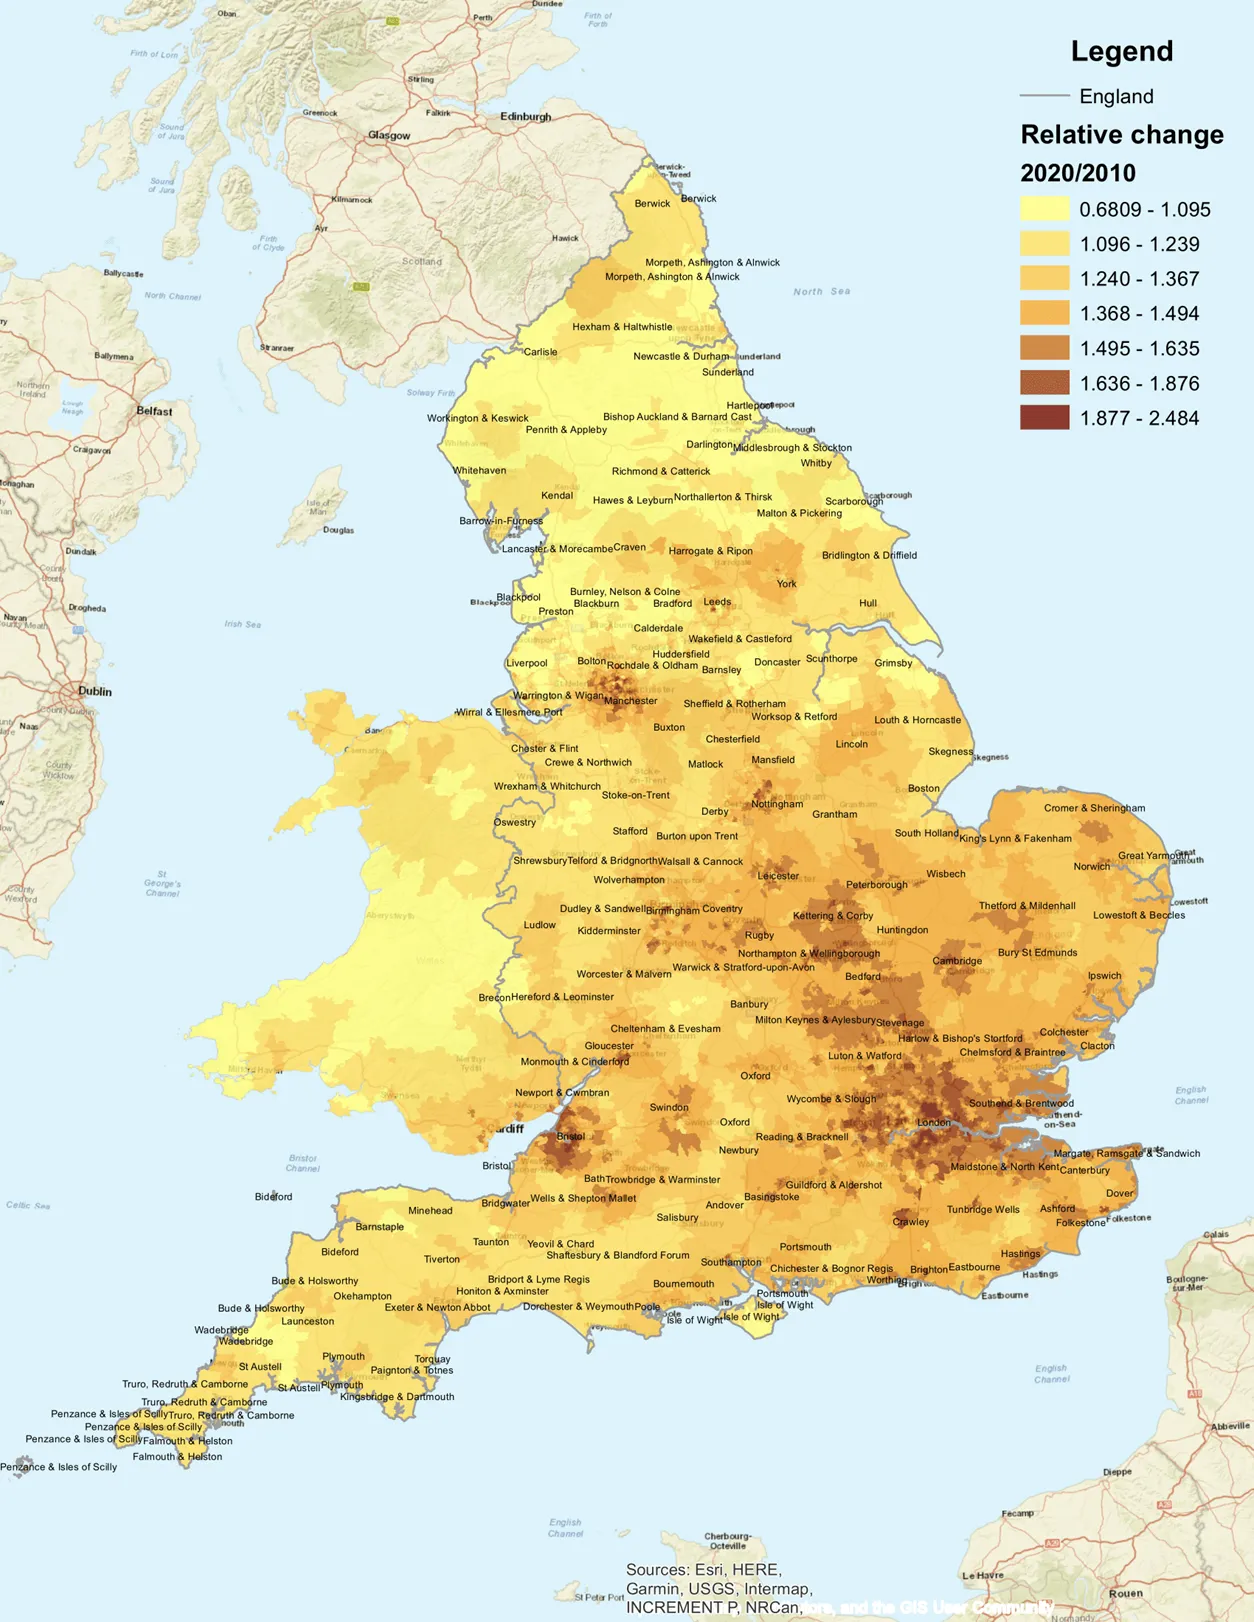
Although both the supply- and demand-side factors individually shape the housing market, their interaction determines the market equilibrium price where the market exchange happens. One of the outcomes of their interaction is the real estate cycle. Different regions do not necessarily have synchronising real estate cycles. The cycle can be roughly divided into four different phases: recovery, expansion, hyper-supply and recession. Different stages of the real estate cycle consist of different levels of vacancy rate, construction level, rental and price levels. For example, in the expansion phase, vacancy decreases, rental level rises, and construction level starts to catch up. However, the extent of rental and sale price increase is subject to the price elasticity of supply – the reaction of housing supply to changes in housing prices. When supply is inelastic, prices rise faster. This is because the rising demand translates into prices instead of construction activities. In general, supply is less elastic in dense urban areas where planners seek to protect historic building stock or open space from (re)development. Hence, it is no surprise that over the past decade, house prices rose fastest in places like Bristol, London, or Manchester as illustrated in Figure 2.
Figure 2. Map illustrates the ratio of the price of a representative house in 2020 over the price of the same house in 2010. For further detail on the underlying data and methodology see, this note and this Centre for Economic Performance Discussion Paper
The determination of the spatial variation of housing prices is complex. Its consequence has a significance impact on both investors who aim to develop of robust investment strategy and potential homeowners who would like to put a roof over their head.