Improving our understanding of income inequality
Income inequality is increasingly a subject of public discussion and analysis. The "go to" official sources for information about UK income inequality levels and trends are the data and statistics produced annually by the Department for Work and Pensions (DWP) and the Office for National Statistics (ONS).
These series are relied on by government departments, think-tanks and pressure groups, social affairs and economics journalists, and academics, as sources of information about fairness in contemporary society, and about how much redistribution is undertaken by the UK’s income tax and benefit systems. They provide benchmarks for cross-national comparisons as well.
Different data, different estimates
Productive debate about what is happening to inequality requires reliable estimates. Yet the two main sources of information – household survey and personal tax return data – provide very different estimates of inequality trends. The income inequality statistics published by the ONS are based on the Living Costs and Food Survey, and those published by the DWP are based on Family Resources Survey data. The DWP series are the basis of the recent statement by a Deputy Governor of the Bank of England that income inequality is "broadly unchanged" over the past quarter century.
Many others have drawn the same conclusions, referring to the same sources. (The ONS series provides a similar picture.) And yet we also know that the share of total income held by the very richest groups in the UK has increased dramatically over the same period – but the main source for this finding is the Survey of Personal Incomes, administrative record data from personal income tax returns held by Her Majesty’s Revenue and Customs (HMRC).
Household surveys are increasingly bad at capturing the income of the very richest people.
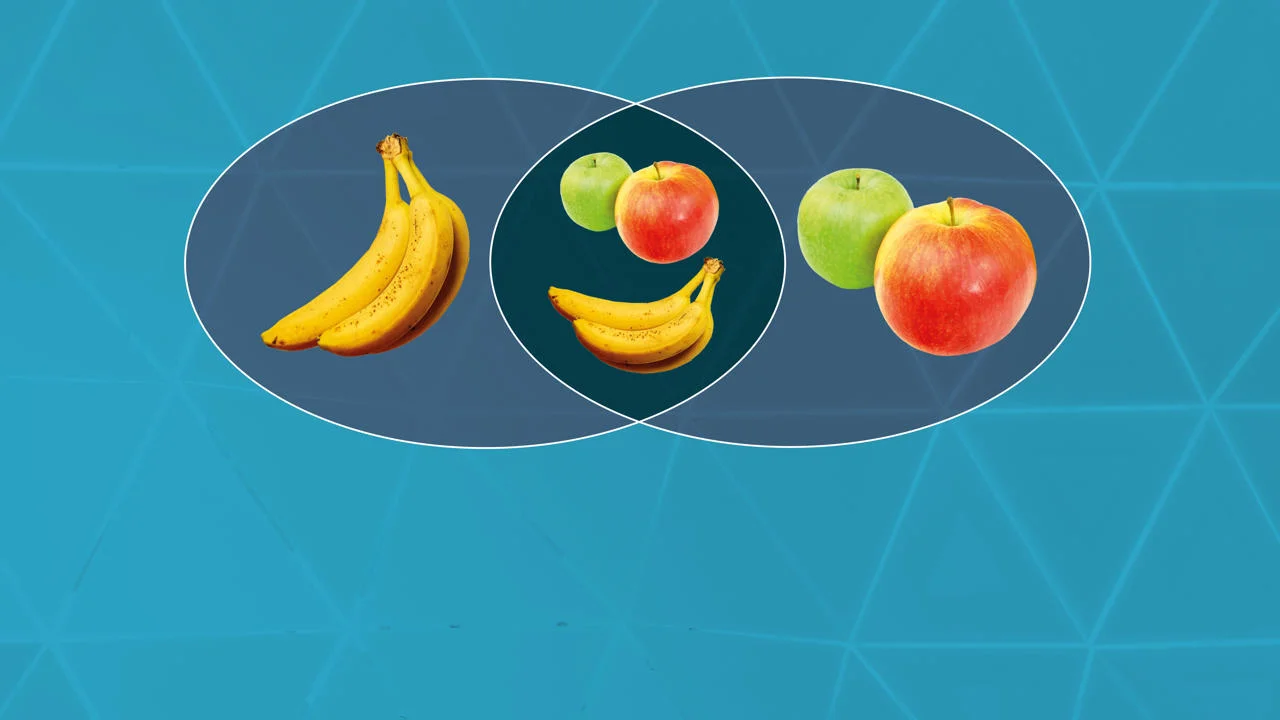
One of the reasons that survey- and tax-based data provide different conclusions is because the statistics derived from them use different definitions of "income" (equivalised disposable income versus taxable gross income, respectively) and the income-sharing unit (households versus individuals). Apples are being compared with bananas, not with apples.
But a more fundamental reason for the different conclusions is that household surveys are increasingly bad at capturing the income of the very richest people – a problem of "survey under-coverage". By contrast, the forte of tax data is their very much better coverage of precisely this group and their incomes. (Compared to surveys, the tax data have worse coverage of the bottom half of the distribution.)
A better measurement of income inequality levels and trends
Research by Richard Burkhauser, Nicolas Hérault, Roger Wilkins, and me shows how to exploit the complementary strengths of survey and tax data to get better measures of inequality levels and trends: combine tax data about the very highest income ranges with survey data about the rest of the income range. You do this after you have put the two datasets on a comparable basis and a common income definition is used.
Our research revealed that inequality levels are higher than shown by the official data.
Our initial reference point is the DWP series. Since the 1990s, DWP estimates have incorporated some information from tax data using a so-called "SPI adjustment" which modifies the incomes of at most the top half per cent of incomes. By contrast, our research shows that, first, in order to properly address top income under-coverage, you need to adjust more top incomes, around three per cent to five per cent. Second, you need to take better account of the inequality that exists even within the very rich group.
Our forensic analysis of the DWP’s SPI adjustment led us to make several recommendations for improvement and in other work we practiced what we preached, adjusting more incomes and taking better account of inequality among the richest. We implemented our methods using data for fiscal years 1995/96 through to 2010/11.
Our research revealed that inequality levels are higher than shown by the official data. This is unsurprising because the essence of our approach is to include more income at the very top of the distribution: the gap between the (new) top incomes on the one hand and middle and low incomes on the other hand has to increase.
But what was particularly interesting was that our methods also suggested different inequality trends. In particular, we showed that there was a greater rise in inequality over the period than the official data showed, especially between 2004/05 and 2007/08.
From research to reality: improving the UK’s use of inequality statistics
A very gratifying consequence of our research is that it has had demonstrable impact on how the UK’s official income inequality statistics are constructed. I had an ongoing dialogue – sharing our team’s methods, results, and recommendations – with the joint ONS-DWP working group considering how to improve the way in which survey under-coverage at the top was addressed. This work was cited in the ONS’s (2018) Transformation of ONS household financial statistics: ONS statistical outputs workplan, 2018 to 2019.
Within a year, the ONS had released a report, Using tax data to better capture top earners in household income inequality statistics (February 2019), that cited our work and road-tested their implementation of our methods and variants on it, as well as extending the analysis to more recent years of data. The ONS work confirmed our findings about higher inequality levels and that inequality trends differ. For example, the ONS old-basis series shows an inequality decline between 2010/11 and 2015/16 whereas the new series shows a rise.
The culmination of the ONS’s development work has been the release of three bulletins in 2020, on income inequality and on the effects of taxes and benefits on the distribution of income, all of which employ the new methods to adjust for survey under-coverage at the top. This signals that the methods based on our research are now part of official statistics and will be so in future. While COVID-19 has halted development work, we hope that the DWP will be able to modify their income distribution series in future as well.
Download a PDF version of this article
Subscribe to LSE Research for the World


Related articles
How much tax do the rich really pay?
Tax cuts for the wealthy only benefit the rich: debunking trickle-down economics
Sophisticated tax evasion by the super-rich